Products.
Echoic S-Plot
RF & Microwave S-Parameter Visualization
iNTRODUCING eCHOIC s-pLOT, A LIGHTWEIGHT, ELEGANT S-PARAMETERS DISPLAY TOOL
DOWNLOAD ECHOIC S-PLOT v1.0.0
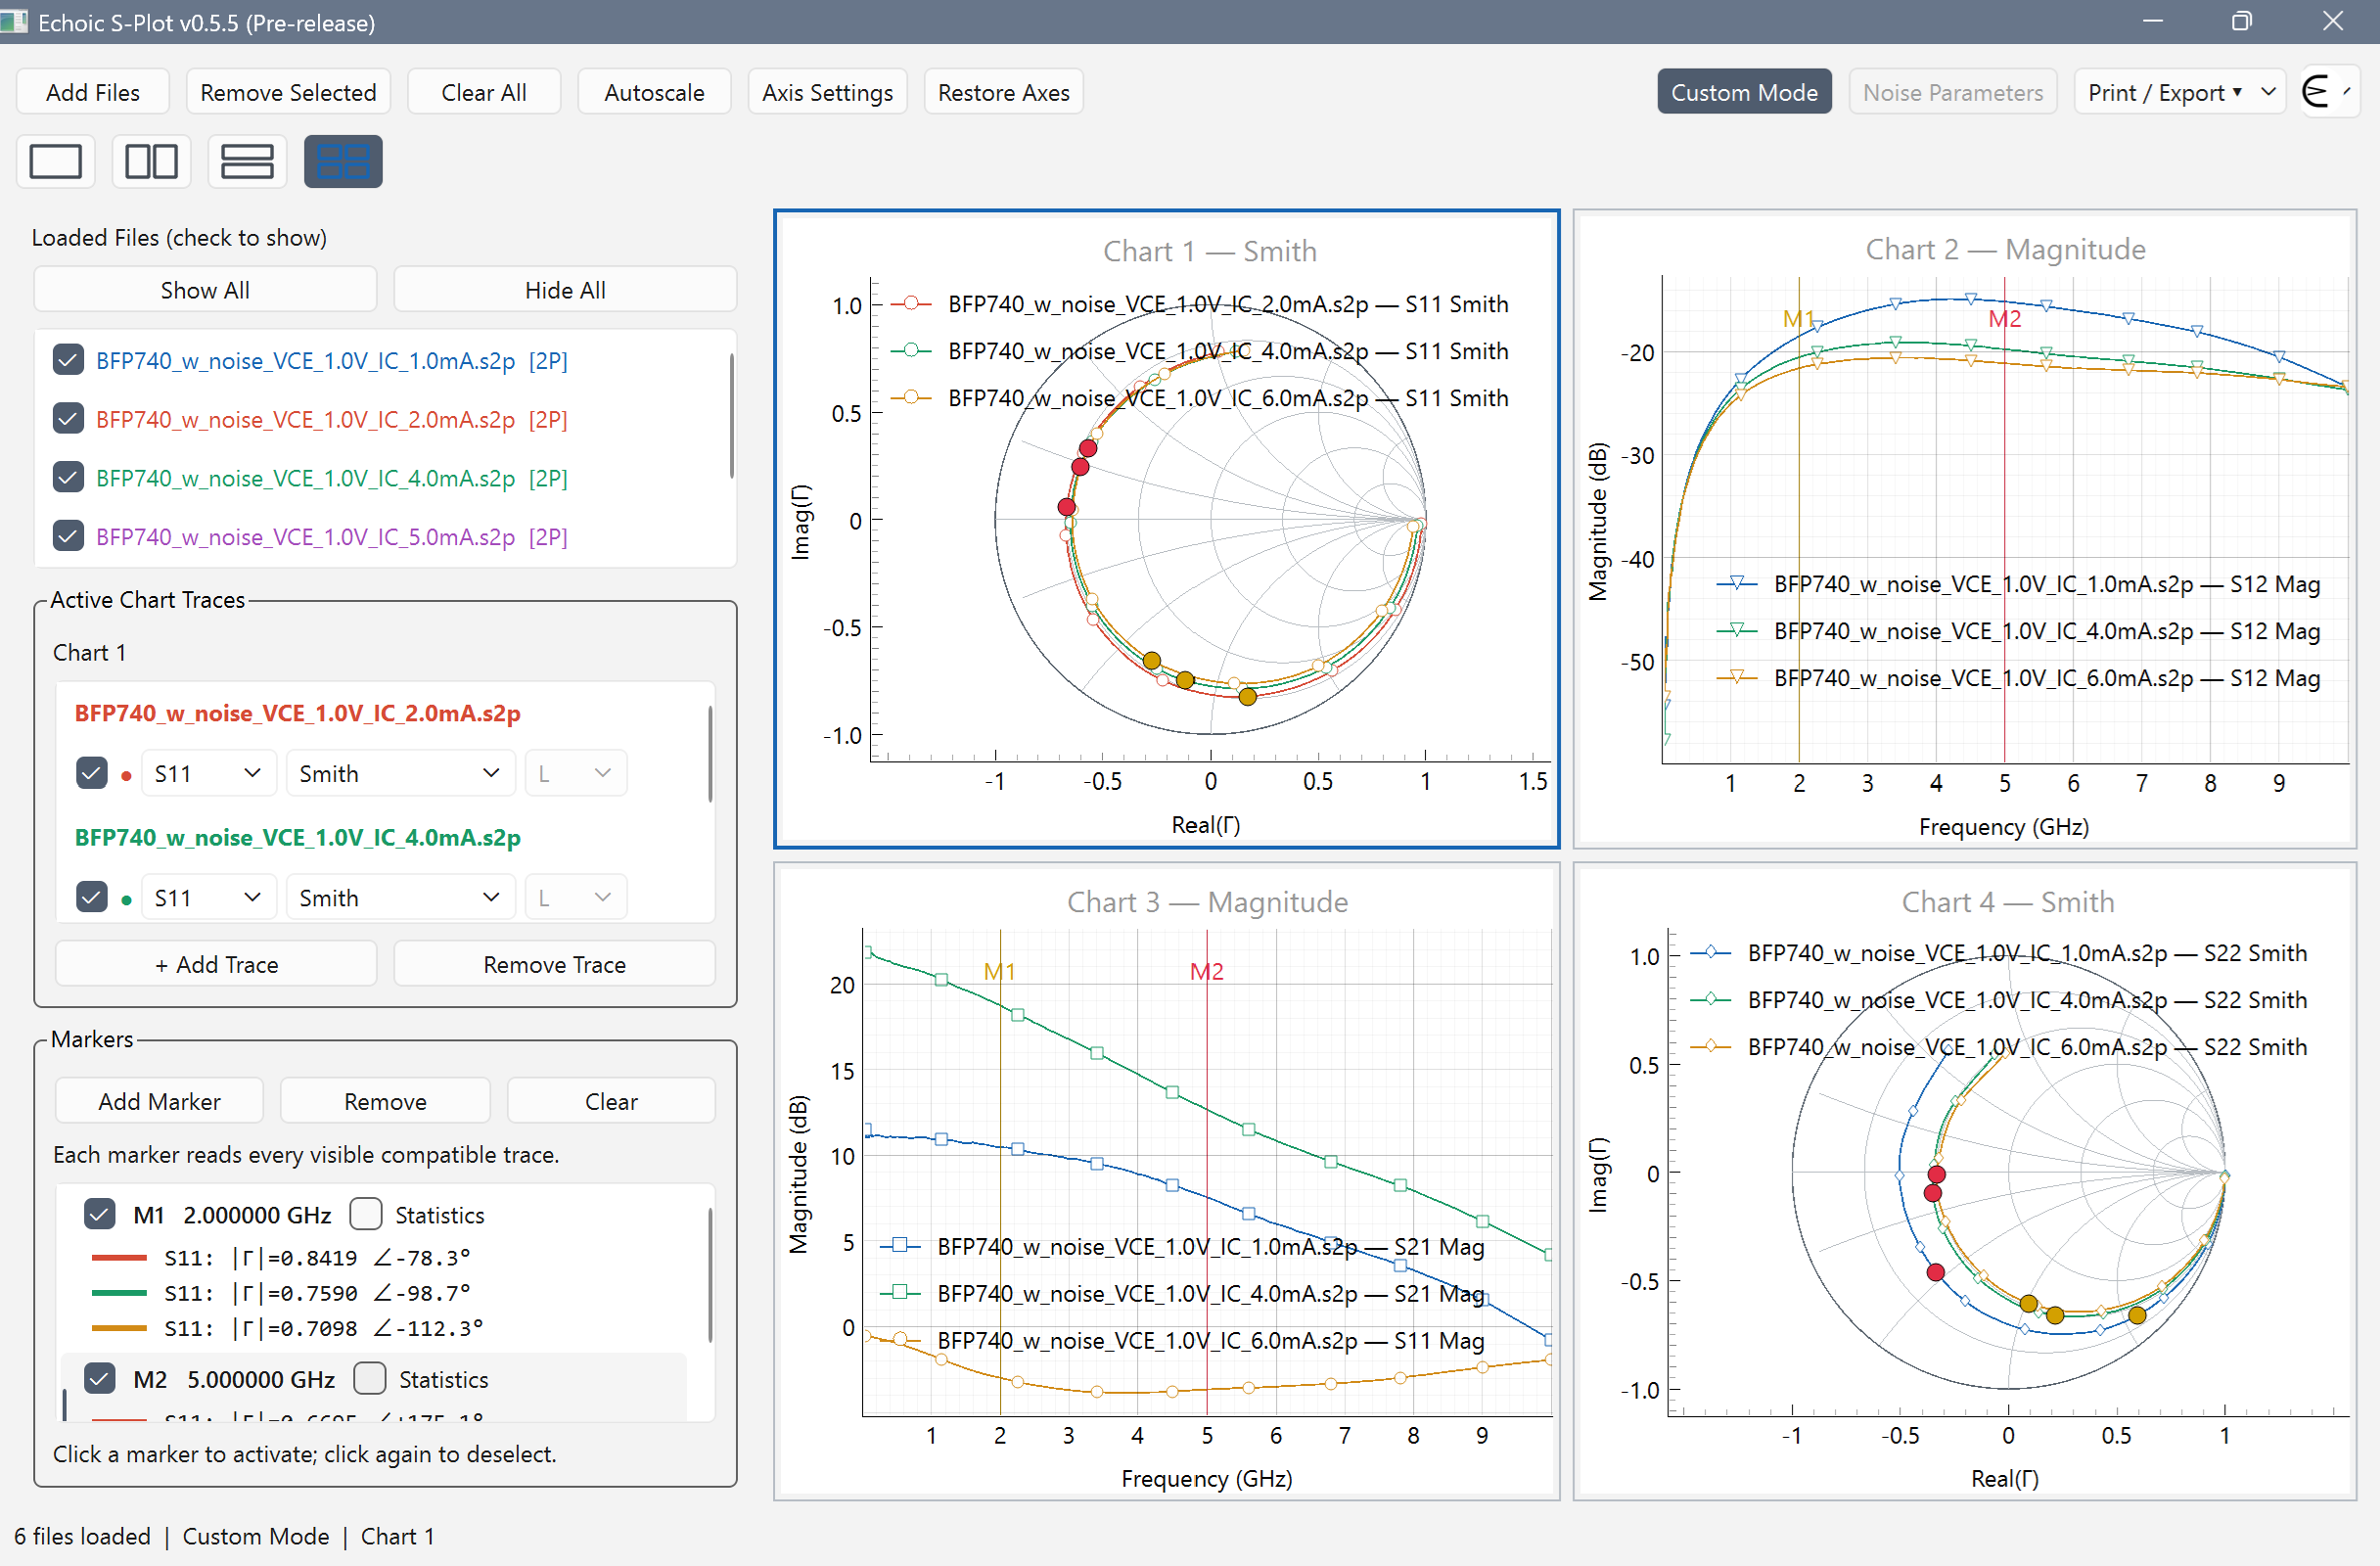
Echoic S-Plot is a lightweight, versatile Touchstone plotting tool designed for RF and microwave engineers. It provides a fast, intuitive way to visualize, analyze, and compare S-parameter measurement and simulation data without the complexity of traditional RF design software.
Plot and compare dozens of Touchstone S2P files simultaneously, with customizable overlays, interactive markers, and powerful RF analysis tools. S-Plot supports magnitude, phase, VSWR, group delay, and Smith Chart displays. Interactive frequency markers, adjustable axes, statistical analysis, and publication-ready plot exports make it easy to evaluate device performance.
Two plotting environments provide flexibility:
Simple Mode for quick S-parameter visualization
Custom Mode for configurable multi-chart layouts, independent trace selections, dual Y-axes, and higher-order multiport Touchstone analysis.
Noise Parameters Mode for plotting and analyzing Touchstone noise parameters.
Developed by Echoic Engineering, S-Plot brings essential RF data visualization tools into a streamlined, easy-to-use application.
Echoic Store
Echoic Store carries an innovative product line to suit your basic RF and Microwave needs.
We use these high-performance passive interconnect components in our own research lab.